CREWS 6: Three Key Dimensions Of Total Value
OVERVIEW
THREE KEY DIMENSIONS OF TOTAL VALUE
Do we have a clear understanding of:
• What Value actually is?
• Why Value is more important than cost?
• How to measure, achieve and demonstrate value?
We are all familiar with commercials that announce tremendous opportunities to acquire value. This often means that a given product or service is available at a lower cost, perhaps “for a limited time only.” A better definition of Value, one that explains its importance in business, is a measure of the Ratio of three factors:
1. Quality (Effectiveness)
2. Speed (Efficiency)
3. Cost (Economy)
As noted in the previous chapter, this is sometimes described as “good, fast and cheap.” If we add the dimension of Quantity (or Volume), to calculate a cost per unit of goods or services, the formula for Value can be expressed informally as:
Note: Each factor is weighted differently by each organization.
Example: One SF of goods or services (say, cleaning) provided at 90% effectiveness (90% completely clean), at a cost of $3.00 (within the specified frequency or timing) has a Value Cost of $3.33 per SF cleaned. Reducing this Value Cost to $3.00 per clean SF is achieved by raising completion to 100%, or lowering the cost to $2.70.
Similar calculations can be performed for cleaning frequencies. Total Value is calculated by including all of these factors and assigning different weights to each. This enables “apples-to-apples” comparisons among different organizations, even though each one uses its own unique weightings to calculate its Total Value.
THREE KEY DIMENSIONS OF VALUE
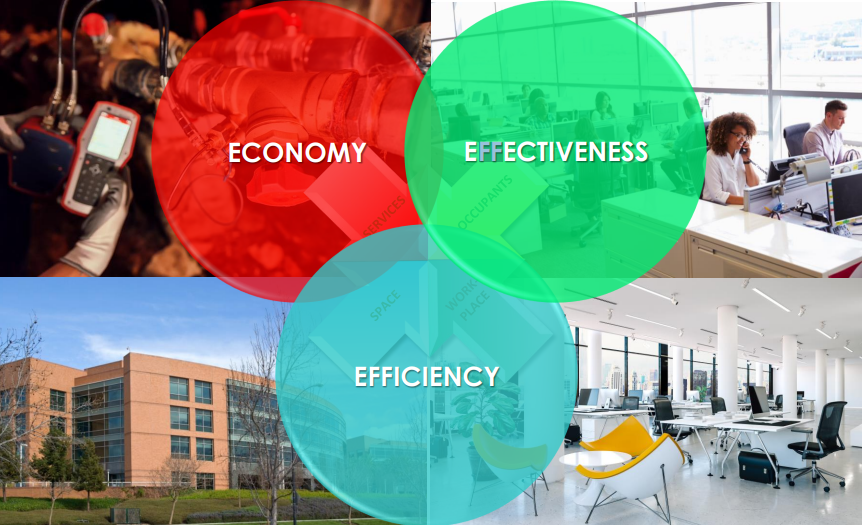
WHEN VALUE = ECONOMY, BEST PERFORMERS HAVE LOWEST COSTS.
NOTE: THIS VALUE CHART SHOWS COMPANIES PARTICIPATING IN A CREWS BENCHMARKING STUDY.
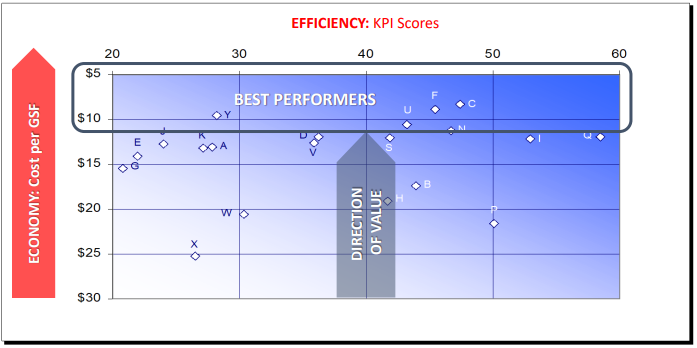
WHEN VALUE = EFFICIENCY, BEST PERFORMERS HAVE HIGH KPI SCORES.
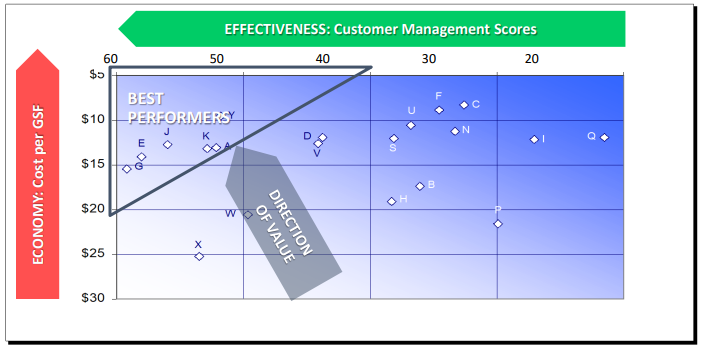
… WHICH COMBINED WITH CUSTOMER MANAGEMENT …
… ACHIEVES TOTAL “3D” VALUE …
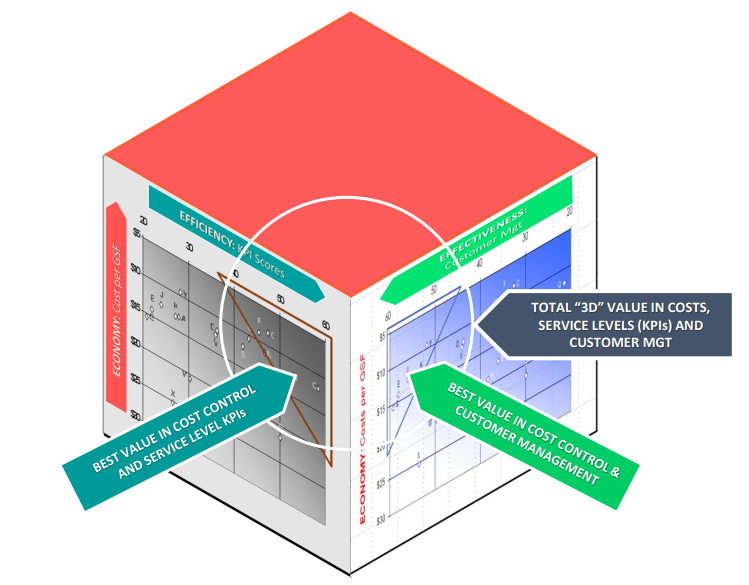
… BY OPTIMIZING ECONOMY, EFFICIENCY, AND EFFECTIVENESS ...
TOTAL “3D” VALUE
One advantage of the three-dimension approach is the separation of objective metrics (Costs and KPIs) from subjective measures (such as Customer Management). Objective metrics such as Costs and KPIs readily permit “apples-to-apples” comparisons among many different firms on an objective, impartial basis.
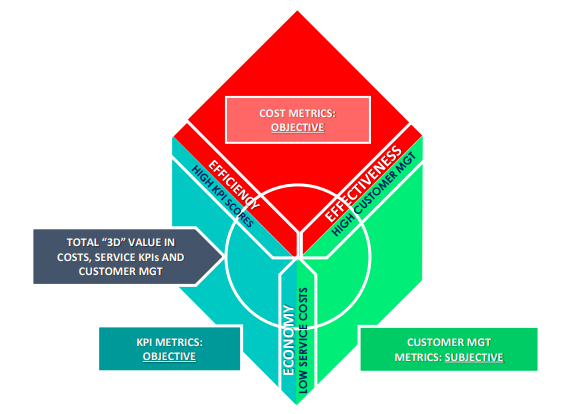
Subjective measures require a different methodology, however, in order to remove distortions that result from cultural and personal factors, which vary significantly among different organizations.
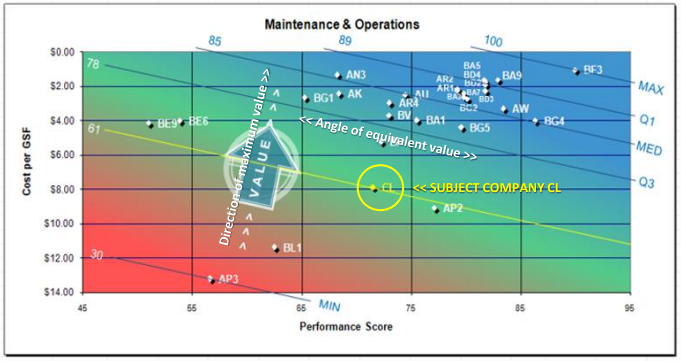
BENCHMARKING VALUE CHARTS
M&O VALUE CHART
The M&O function includes a wide range of different tasks, with numerous Key Performance Indicators (KPIs). Each KPI is weighted by importance, with life safety highest and minor repairs & comfort issues lowest. The vector of higher value and angle of equivalent value reflects the relative weighting of costs and performance. Cost is rated higher than KPIs for this firm (Co. CL). For them, a higher value will require better cost control.
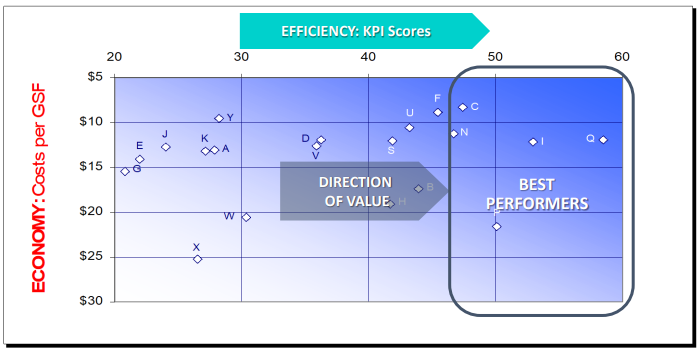
BENCHMARKING GAP ANALYSIS
M&O GAP ANALYSIS
This view of the Value Chart shows preliminary gap analysis in costs and performance for Company CL and its position on the Value Scale, based on weighted values for cost and performance KPIs. It also shows how Co. CL stacks up against “Best Performers” and the gaps that need to be closed to join them in Quartile #1.
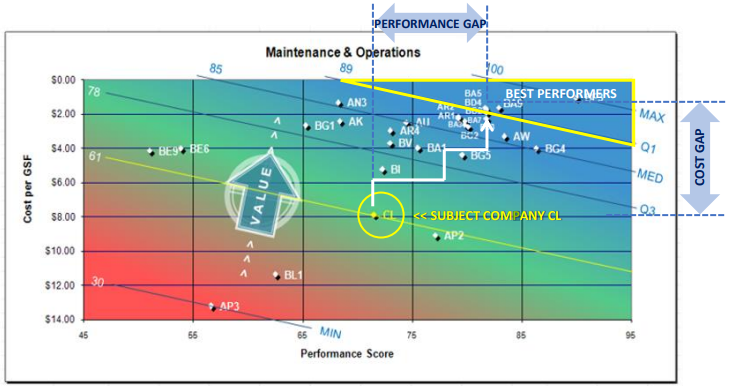
The white line indicates the path Co. CL can take in order to close these gaps and attain “Best Performer” status over a three-year period. For information on KPIs, and the specific, quantitative improvements needed, see “KPI Improvement Targets,” which will be issued in a subsequent chapter
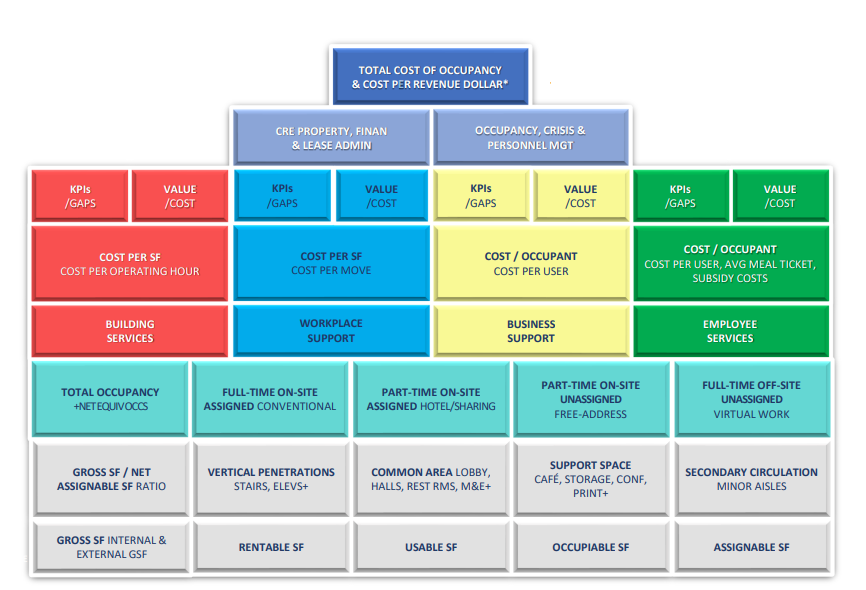
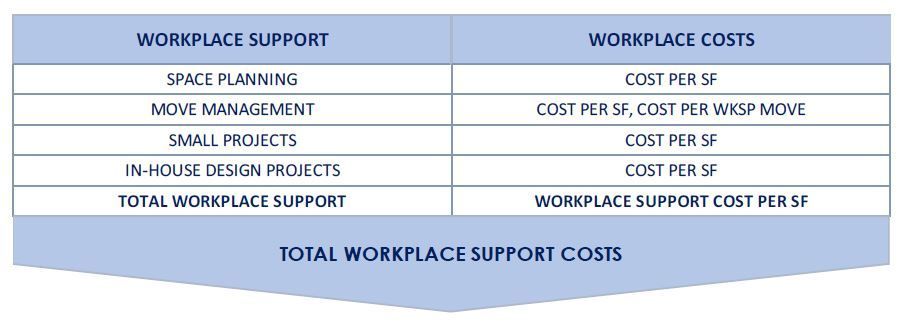
BUILDING BLOCKS OF VALUE
KEY CREWS METRICS
Beginning with Space & Occupancy, a hierarchy of Key Metrics helps to plan and develop CREWS Value.
*CPRD: COST PER REVENUE DOLLAR, I.E., TOTAL CREWS COSTS / COMPANY REV
CONCLUSION
WHY IT’S IMPORTANT
We noted earlier that it’s essential to establish measurable goals and achievements. The three-dimensional approach we describe allows CREWS to go beyond a cost-only focus, in which it is viewed as a commodity, and subjected to constant cost-reduction efforts. Clear goals for efficiency and effectiveness, in measurable terms, make it is possible to plan, achieve and demonstrate value, and articulate a clear CREWS value proposition.
We’ve noted the difference between objective measures, such as costs and KPI scores, and subjective ones. Gaps often exist between customer priorities and performance levels in subjective areas. Another way to say it is that many organizations fail to “major on the majors.” Too many groups excel in areas that matter more to themselves than to their customers. This is why the third dimension is critical in attaining meaningful value.

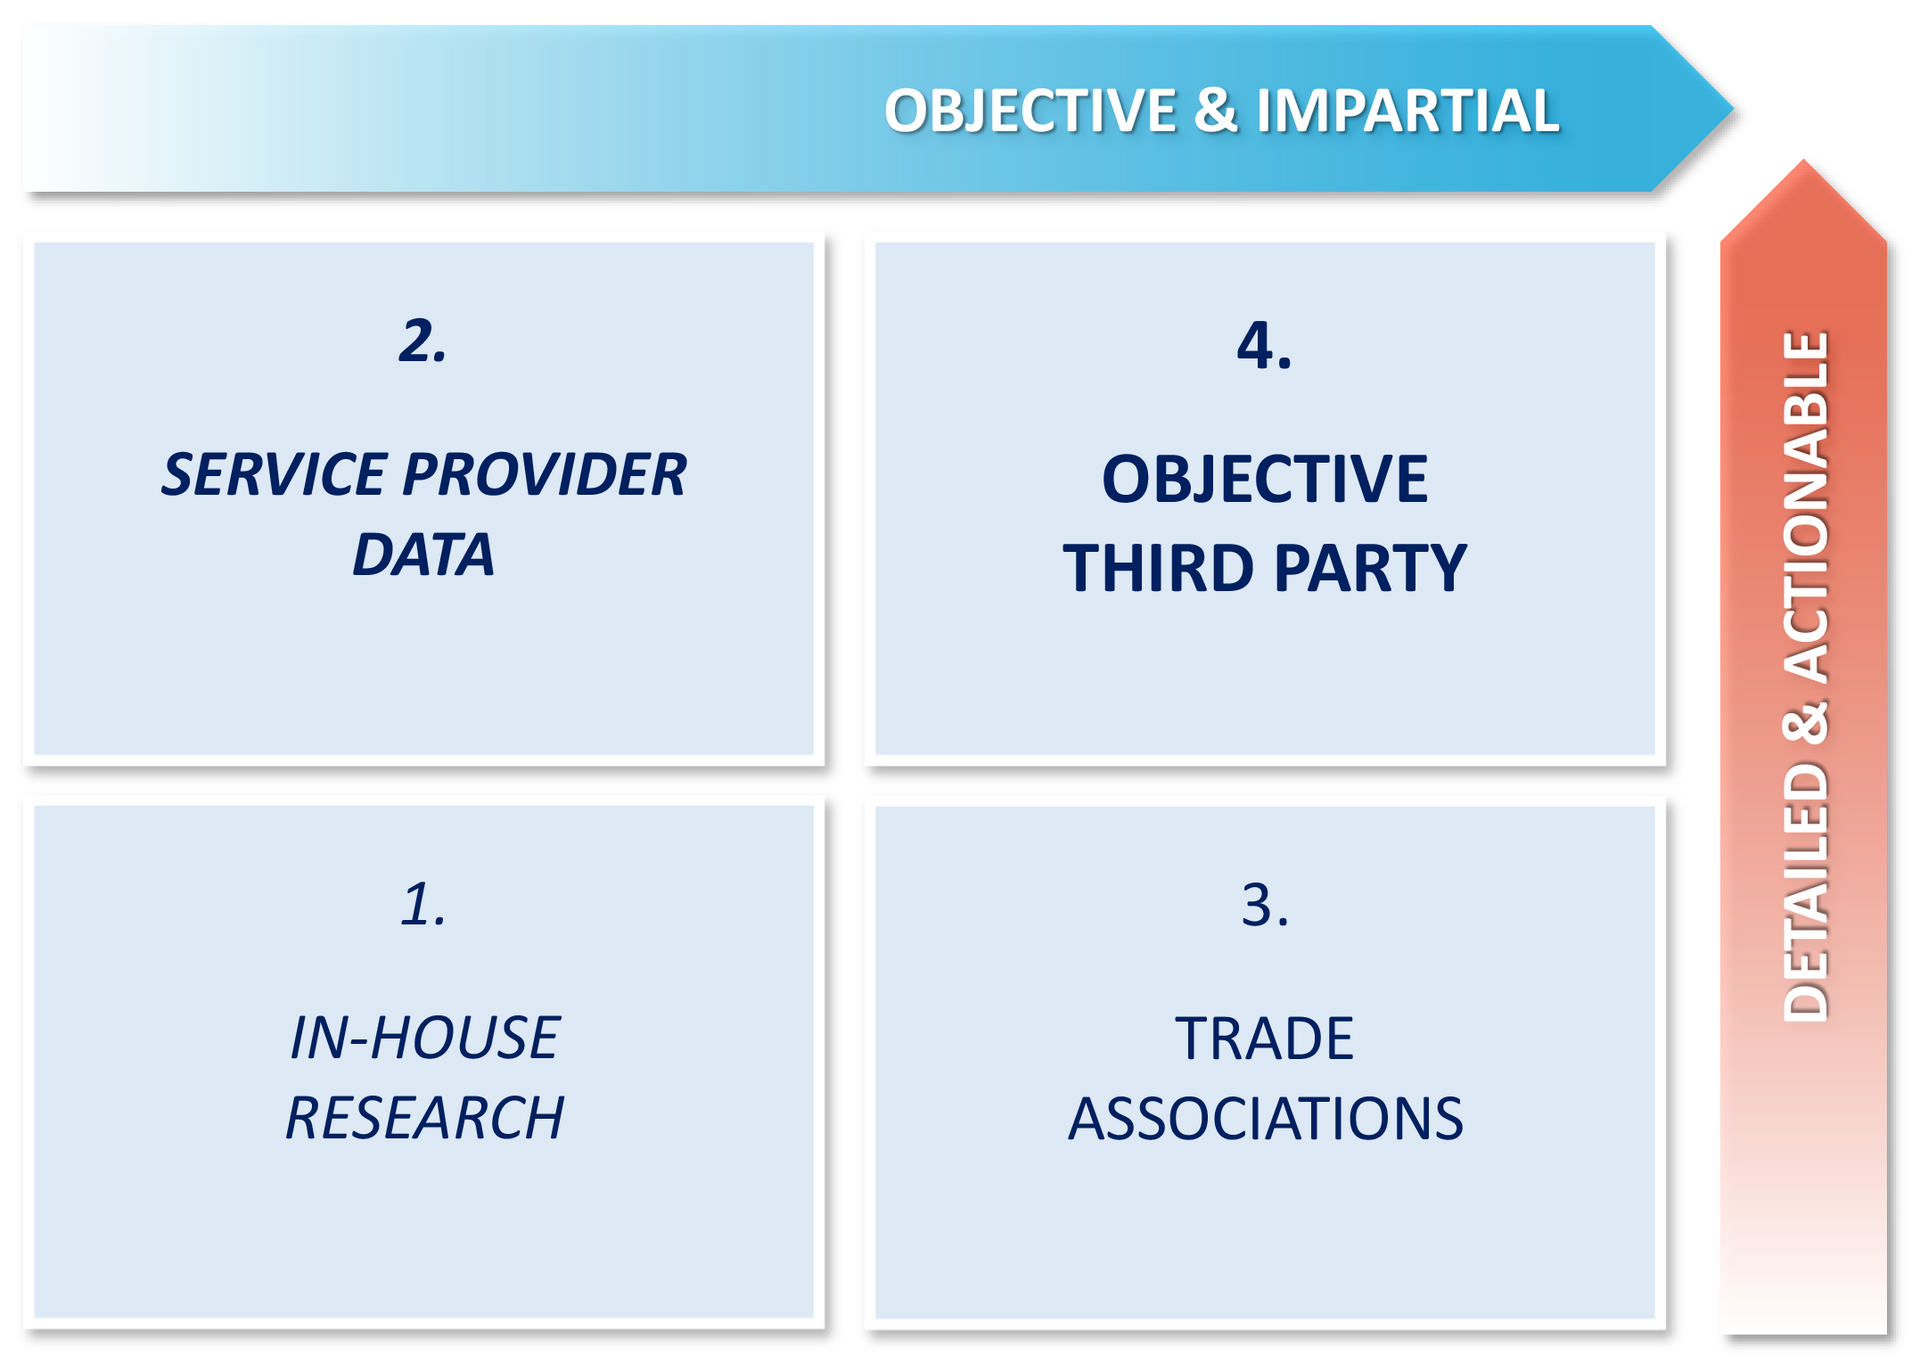
HOW WE CAN HELP
We’ve conducted studies for a wide range of firms, many of the leaders in their industries, who recognize the advantages of a leadership position. We provide them with rigorous, thoughtful evaluations based on our 25+ years of experience, plus our prior hands-on knowledge of the field.
We offer detailed comparisons in all three dimensions of Value: Economy, Efficiency, and Effectiveness. Our benchmarking evaluations compare Costs, Service Levels (KPIs), and Customer Satisfaction in the Workplace.
Our evaluations show how to raise performance while reducing costs, by establishing and attaining aggressive but achievable goals for the organization. We can tailor an evaluation to your own portfolio, facilities, workplace, workforce, and current management needs, and help you become the best performer.
THANK YOU!


The Window To World Class Performance Since 1996
PHONE:
EMAIL:
Address:
1936 Long Hill Road #285
Millington, NJ 07946