CREWS 4: Key Metrics in Space, Occupancy & Costs
OVERVIEW
KEY METRICS IN SPACE, OCCUPANCY COSTS
How do we know:
• How much space do we really need?
• How many net equivalent occupants do we have?
• How much more (or less) we should be spending?
Answers to these and many more key questions lie in your Key Metrics. Comparing with similar firms and facilities is the best way to identify your optimal targets, answer questions like those above, and identify major potential savings or improvements. Compiling data among dozens or even hundreds of sites can be problematic, especially in a dynamic corporate environment with frequent changes, relocations, mergers, acquisitions, or other types of change. Acquiring consistent data requires a long-term data management plan.
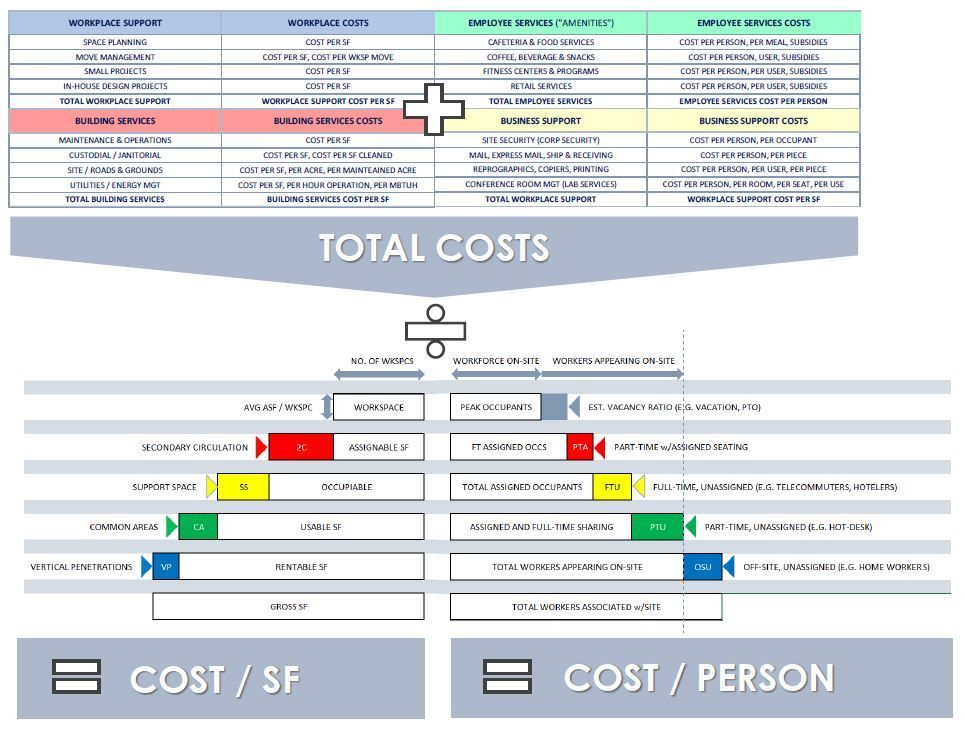
We use “Prismetrix," a comprehensive model of costs for the numerous services in facilities and real estate. Prismetrix provides an integrated overview of costs and linkages with Total Costs per SF and per Occupant. Once data has been compiled and validated, robust comparisons with benchmarks and with peer firms and facilities become possible. All metrics and measurements are based on recognized industry standards.
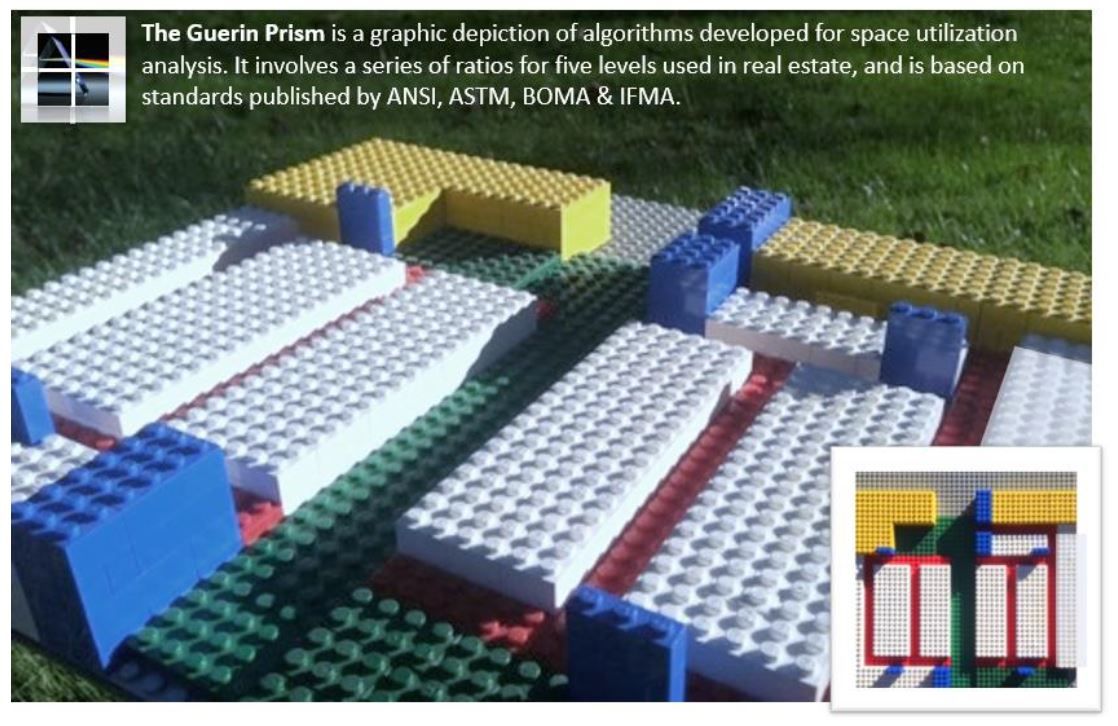
The superstructure of this model is the Guerin Prism, which illustrates key relationships in building design, workplace standards, and occupancy patterns within the organization’s facilities. Prism-based diagrams are "Parametric," meaning they are designed to illustrate changing data. They provide a “big picture” overview including all keyspace and cost data involved in the facility. This makes it possible to compare facilities side-by-side (or back-to-back), to highlight key differences at a glance.
Note: Some of the following material appeared earlier in “CREWS 3: Services & Organization." It has been updated and moved to this section to achieve a better fit with the subject and content.
PRISMETRIX: TOTAL SPACE & COST MEASUREMENTS
WHAT IS PRISMETRIX?
Prismetrix is GA’s unique, visually dynamic method of compiling, validating, comparing, and analyzing real estate and facilities management data in a clear, comprehensive way.
Prismetrix utilizes well-accepted cost categories and metrics to generate benchmarking data for
- Internal data documentation of progress
- Internal comparisons among sites or regions
- External benchmarking with peer companies
It is also extremely useful in setting up standard, recognized definitions for space, allocation of space by usage, scopes of facilities services, categories of internal and outsourced labor, etc.
Clear definitions are necessary to maintain consistent data over time, and enable “apples to apples” comparisons within and beyond the firm, It is also important to establish definitions that are most useful for internal management oversight rather than most useful to service providers.
Each vendor has its own system for cost tracking, or benchmarking using its own database Managers may then find that they need to maintain two sets of data, or can become overly dependent on their vendors. We recommend firms take the lead in their data management to preserve the greatest number of options in using, comparing, and improving results.
Notice: Prismetrix and the Guerin Prism are proprietary to Guerin Associates and confidential to their intended
recipients. These may be used 1. Internally, or 2. In public forums with acknowledgment of GA as the source. 3. Commercial use is permitted only with prior written permission from Guerin Associates.
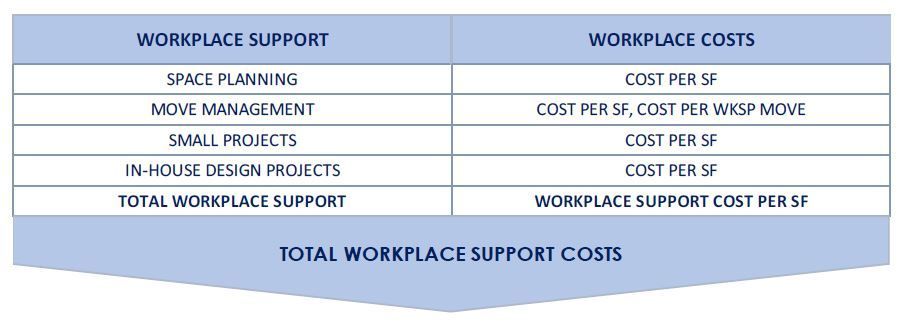
PRISMETRIX: WORKPLACE SUPPORT
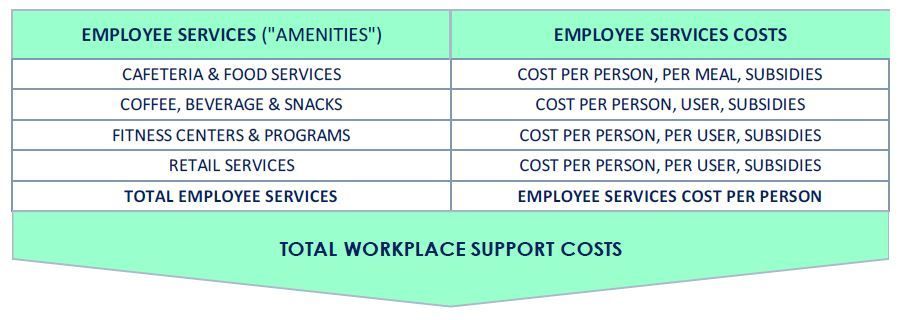
PRISMETRIX: EMPLOYEE SERVICES
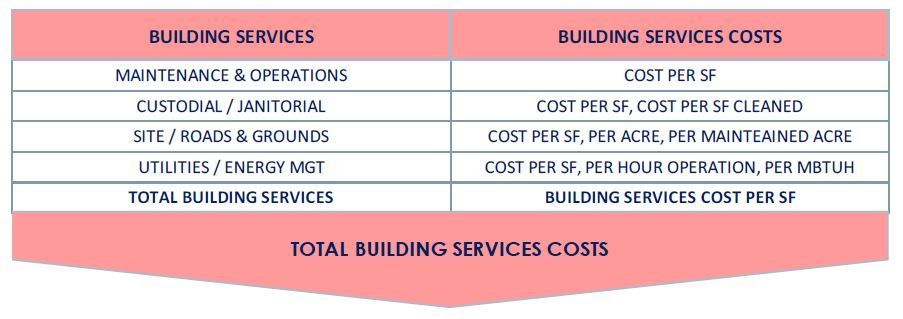
PRISMETRIX: BUILDING SERVICES
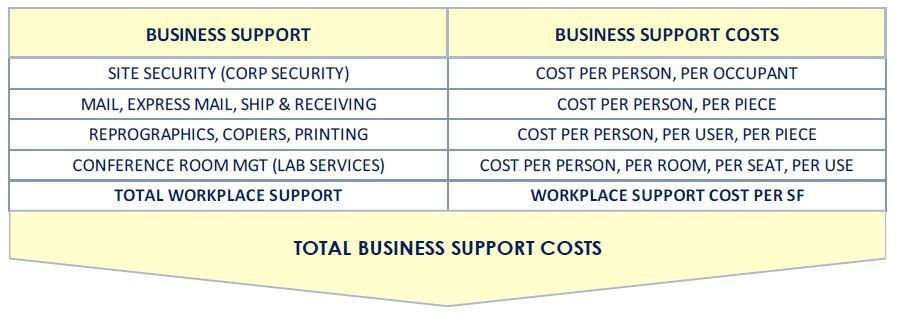
PRISMETRIX: BUILDING SUPPORT
THE GUERIN PRISM: THE WINDOW TO DESIGN ANALYSIS
THE GUERIN PRISM: BUILDING, WORKPLACE & OCCUPANCY
THE FUNDAMENTALS
1. Some building designs are based on pre-established programs that generate space requirements. Supporting spaces are then developed and added, usually in the sequence shown, to complete the overall building plan.
2. Some footprints are established by an existing building envelope, or by the limitations of a particular site.
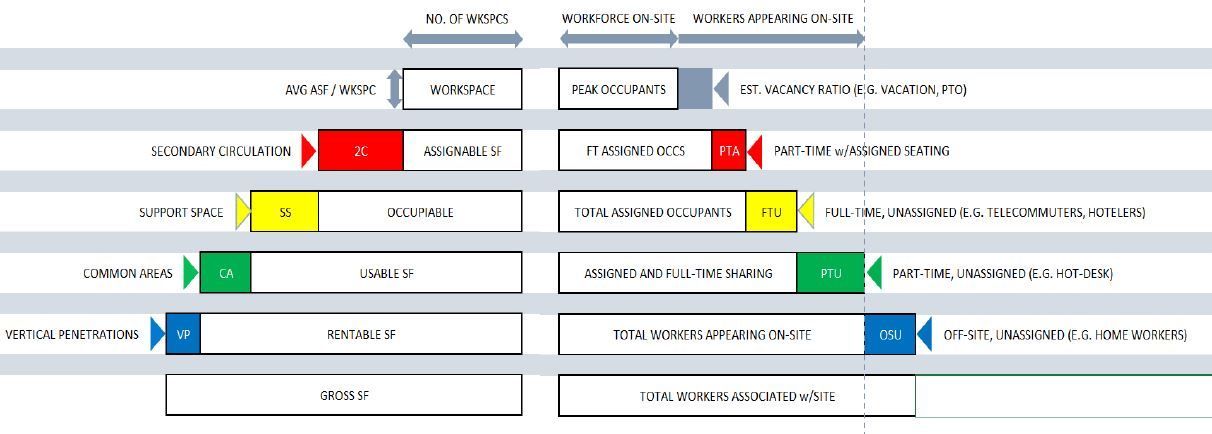
The diagram shown here illustrates the first of these methods, generating a Gross SF footprint through a series of successive “markups” of varying efficiencies. The resulting total can cover a wide range of Gross / Net ratios. We refer to this as the GPA (Guerin Prism Average). Total capital project costs are directly related to this ratio.
Note: This method is also reversible, to analyze the potential capacity of a fixed building envelope or site limits.
PRISMETRIX: BRINGING EVERYTHING TOGETHER
CONCLUSION
WHY IT’S IMPORTANT
Once the Vision & Mission have been established, it’s essential to translate these into measurable goals and achievements. The absence of clear, achievable objectives makes failure to achieve them a virtual certainty. It’s critical, however, to establish a consistent set of measurement standards that will enable accurate analysis.
Our measurements are based on recognized and accepted standards used in publications of leading professional associations, such as IFMA, BOMA, ASTM, ANSI, R S Means, and numerous other sources.
The models we show here are based on many years of experience in measuring, comparing, and analyzing costs and performance for clients representing some of America’s top firms in their industries. These companies recognize that the future is a moving target. For them, continuous learning and improvement are not only unavoidable. They are actually essential to success.

HOW WE CAN HELP
We’ve conducted studies for a wide range of firms, many of the leaders in their industries, who recognize the need to retain a leadership position. We provide them with rigorous, thoughtful evaluations based on our 25+ years of experience, plus our prior hands-on knowledge of the field.
Our evaluations show how to raise performance while reducing costs, by establishing and attaining aggressive but achievable goals for the organization. We can tailor an evaluation to your own portfolio, facilities, workplace, workforce, and current needs, and help you become the best performer.
THANK YOU!


The Window To World Class Performance Since 1996
PHONE:
EMAIL:
Address:
1936 Long Hill Road #285
Millington, NJ 07946